How to Install and Configuration Cacti Monitoring
0 people liked this article
A. INTRODUCING
Cacti is an open-source, web-based network monitoring and graphing tool designed as a front-end application for the open-source, industry-standard data logging tool RRDtool. Cacti allows a user to poll services at predetermined intervals and graph the resulting data. It is generally used to graph time-series data of metrics such as CPU load, memory, and network bandwidth utilization. A common usage is to monitor network traffic by polling a network switch or router interface via Simple Network Management Protocol (SNMP).
The front end can handle multiple users, each with their own graph sets, so it is sometimes used by web hosting providers (especially dedicated server, virtual private server, and colocation providers) to display bandwidth statistics for their customers. It can be used to configure the data collection itself, allowing certain setups to be monitored without any manual configuration of RRDtool. Cacti can be extended to monitor any source via shell scripts and executables.
The primary features of Cacti:
- Unlimited graph items
- Tree, list, and preview view of graph data
- Graph data manipulation
- Graph aggregation
- Device, graph, and tree automation
- Data source template
- Device template
- User and user group base management and security
B. INITIAL PREPARATION
For ubuntu do update first
# apt-get updateInstall cacti packages so that Cacti can be used.
# apt-get install apache2 php php-cli php-mysql php-snmp mysql-server mysql-client snmp spilih apache2 pada web server nmpd rrdtool cactiChoose apache for webserver
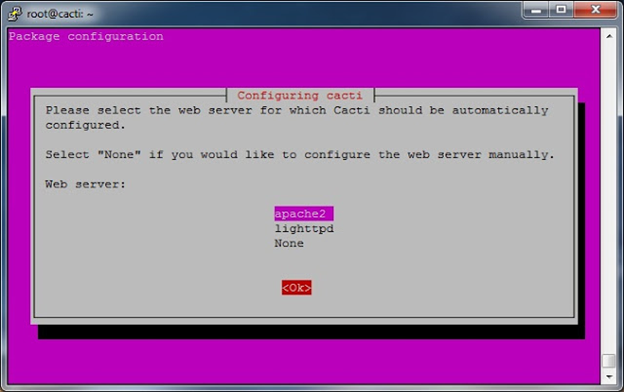 1. Select Web server
Next choose yes for configuration database cacti
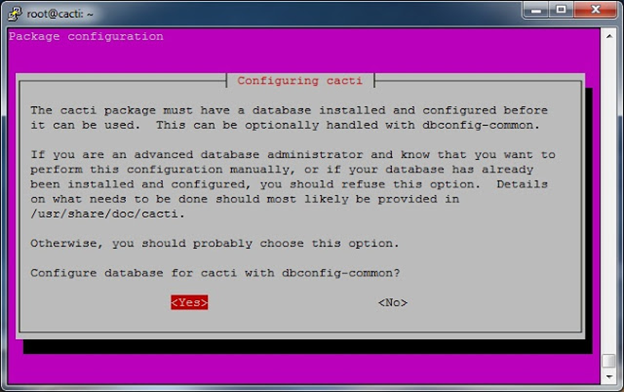
2. Configuring Database
C. CACTI CONFIGURATION
DATABASE
Login to mysql use root user, and give access for cacti
# mysql -u root -p
mysql> GRANT ALL PRIVILEGES ON cacti.* TO 'cactiuser'@'localhost' IDENTIFIED BY 'masukkan password user cacti';
mysql> FLUSH PRIVILEGES;
mysql> quit
Configuration Cacti
Configuration cacti php file for set username and password used in database.
# vi /usr/share/cacti/site/include/config.php
$database_type = "mysql";
$database_default = "cacti";
$database_hostname = "localhost";
$database_username = "cactiuser";
$database_password = "cactiuserpassword";
$database_port = "3306";
$database_ssl = false;
Configuration Apache
Make file apache for configuration
# vi /etc/apache2/sites-available/cacti.conf
Put text below in cacti.conf
Alias /cacti /usr/share/cacti/site
<Directory /usr/share/cacti/site>
Options +FollowSymLinks
AllowOverride None
order allow,deny
allow from all

DirectoryIndex index.php
</Directory>
CRON
Add Crontab below, if the text below already do not add it :
# vi /etc/cron.d/cacti
*/5 * * * * cacti /usr/bin/php /usr/share/cacti/poller.php > /dev/null 2>&1
RUNNING CACTI
Use web browser for open cacti page user address http://IP_address_server/cacti
 3. Running Cacti
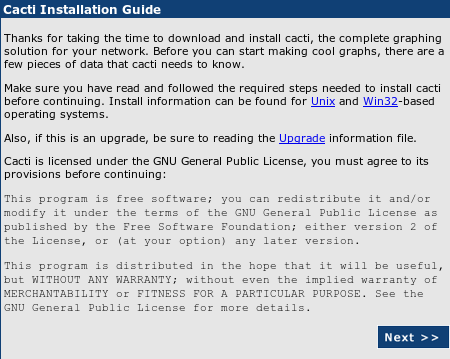
In the display above, show that Cacti has been successfully installed and then install on the Cacti page. Click Next to continue to the next page.
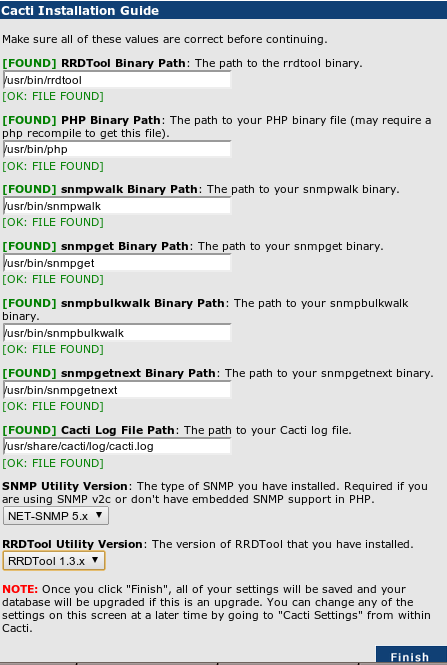
Then choose “ New Install” because you just installed cacti on this server. If you have clicked Next to continue. If your configuration is all correct or all is correct [FILE FOUND], the display will look like below. For SNMP and RRD Tools, it must match the version used on your server. Click Finish to continue.
 4. New Installation
Next login with user you have created.
Create a new device by selecting “Create Device”. After that, fill the dialog box below, with host information you want to monitor. Fill localhost for the cacti device itself
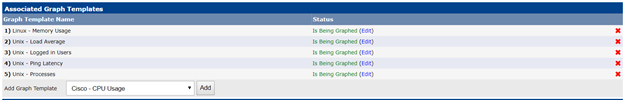
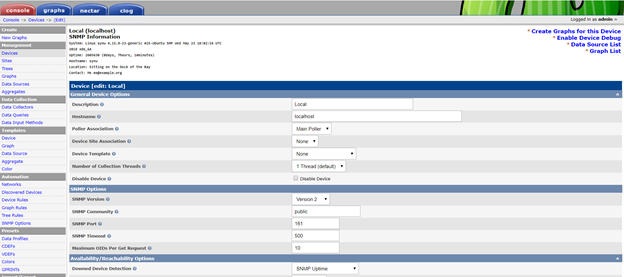 5. Login to CactiAt Associated Graph Templates, fill it with the need for monitoring, e.g memory usage, running processes, load average, and others.
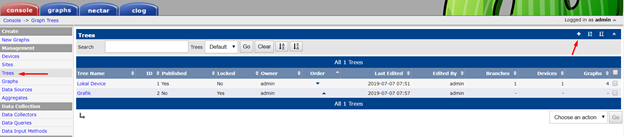
 6. Select Template MonitoringAfter that click “Tree” next click “+” for add graph tree. Click Edit Tree for edit for edit graph tree. Next click Add Root Branch for add main folder graph.
7. Add Graph TreeNext do drag and drop graph which in third column into the first column to display graph.
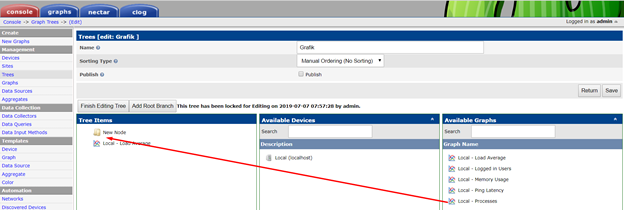
8. Edit Graph Tree
After that click Finish Editing Tree then click Save.
To see graph click Graph at the top, the display graph appears as below.
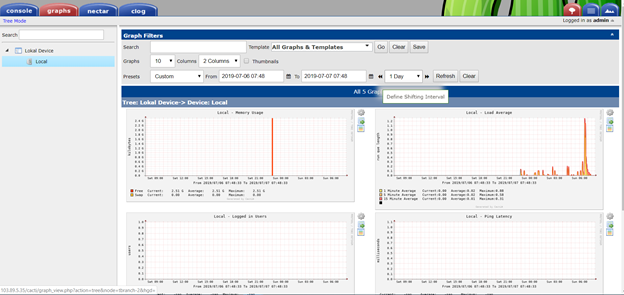 9. View Graph
D. Summary
This article provides a fairly detailed and comprehensive guide on how to install and configuration cacti monitoring. Running Cacti is done through a web browser, and after installation, users can log in to create devices, set up graph templates, organize graphs into trees, and ultimately view the generated graphs to monitor their network. Find help others via the Biznet Gio Knowledge Base. If you still have problems, please contact support@biznetgio.com.
Popular Articles
-
Cara Install & Konfigurasi Monitoring Cacti Serta Mengetahui Fungsi Fitur Pada Cacti
15 people say this guide was helpful
-
Cara Mengaktifkan Telnet pada Windows 7, 8 dan 10
5 people say this guide was helpful
-
Install dan Konfigurasi Samba Server pada Ubuntu
5 people say this guide was helpful
-
Jenis-Jenis Software Virtualisasi untuk Membuat Virtual Machine
7 people say this guide was helpful